

Calculate the order uplift a discount needs to cover lower contribution and campaign spend, with a worked UK example.

A discount can bring more orders and still leave less contribution behind. The useful question is not simply how many extra orders you hope to get. It is how many orders the discounted price needs to cover the contribution you give up, plus the campaign spend.
To estimate the break-even order uplift, calculate contribution per order at the usual price and at the discounted price, add the promotion spend to your normal contribution target, then divide by contribution per discounted order. This guide walks through that calculation with a UK example in pounds. The figures are illustrations, not a forecast or a recommendation to discount.
Enter a monthly order baseline, usual price, variable cost, fee rate, discount and campaign spend. The free lab compares the two contribution scenarios and estimates the uplift needed to match your baseline.
Order uplift is the change in order volume compared with a chosen baseline. If a shop normally receives 300 orders in a month and receives 330 during a comparable promotion period, the observed uplift is 10%. That comparison is only useful when the periods, channels, order definition and measurement method are reasonably consistent.
Break-even order uplift is the estimated increase in orders required for the promotion scenario to produce the same contribution as the baseline after the campaign spend you enter. It is a modelled threshold. It does not tell you whether customers will respond, whether the campaign will reach them, or whether your fulfilment operation can handle the volume.
Revenue is the money recorded from sales under the definition used by your shop report. Contribution is the amount left after the variable costs included in your calculation. For this example, contribution per order is the selling price less the variable cost per order and the payment or selling fee applied to the price.
Use one consistent basis. If your selling price includes VAT, decide how your cost and fee figures relate to that price and check the treatment in your own accounts. This simple example does not model VAT, returns, refunds, shipping, stock constraints, fixed overheads or other costs unless you include them in the variable cost you enter.
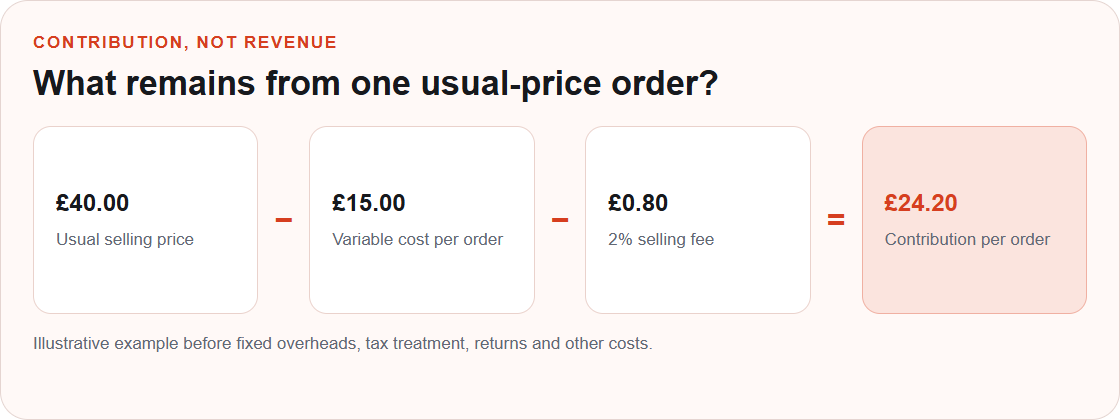
With a usual selling price of £40, a variable cost of £15 and fees of 2% of the selling price, the fee is £0.80. The contribution is £40 − £15 − £0.80 = £24.20 per order. If the real fee has a fixed component, tiered rates or a different basis, use the effective cost that matches the orders you are comparing.
Formula: Required promotion orders = (baseline contribution + campaign spend) ÷ contribution per discounted order. Then: break-even order uplift = (required promotion orders ÷ baseline orders − 1) × 100.
The baseline contribution is the contribution from your normal order volume for the period you chose. The campaign spend is added because the promotion must cover that cost as well. The result is divided by the contribution left on each discounted order. Finally, compare those required orders with your baseline order count to express the gap as a percentage.
If each discounted order has zero or negative contribution after the costs included, there is no finite break-even order target in this model. More orders at a negative contribution per order make the gap larger. Recheck the selling price, discount and costs before treating an uplift calculation as meaningful.
Suppose the shop has 300 orders in a normal month. The usual price is £40, variable cost is £15 per order, fees are 2% of the selling price, the proposed discount is 10%, and campaign spend for the period is £150.
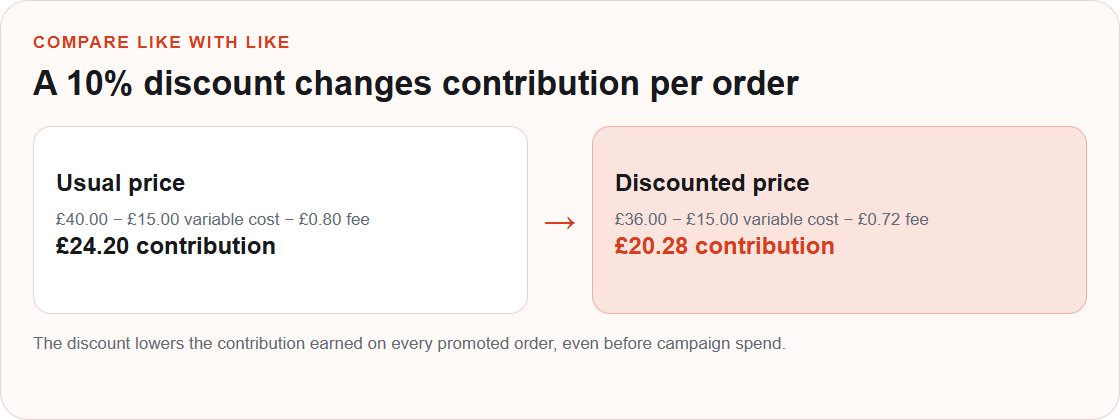
A 10% discount changes the price to £36. The 2% fee at that price is £0.72. Subtract the same £15 variable cost and the promoted order contributes £20.28 before campaign spend. The discount has reduced contribution per order from £24.20 to £20.28, a difference of £3.92.
| Measure | Usual month | Promotion scenario |
|---|---|---|
| Orders | 300 | 375 at 25% estimated uplift |
| Price per order | £40.00 | £36.00 after 10% discount |
| Contribution per order | £24.20 | £20.28 |
| Contribution before campaign spend | £7,260.00 | £7,605.00 |
| Campaign spend | £0.00 in this comparison | £150.00 |
| Contribution after entered spend | £7,260.00 | £7,455.00 |
| Difference from baseline | Baseline | +£195.00 in this model |
At 375 orders, the estimated 25% uplift produces £7,455 of contribution after the £150 campaign spend, which is £195 above the usual month in this model. That is a scenario result, not evidence that a 25% increase will happen. The break-even calculation asks a different question: what is the minimum modelled volume needed to match £7,260?
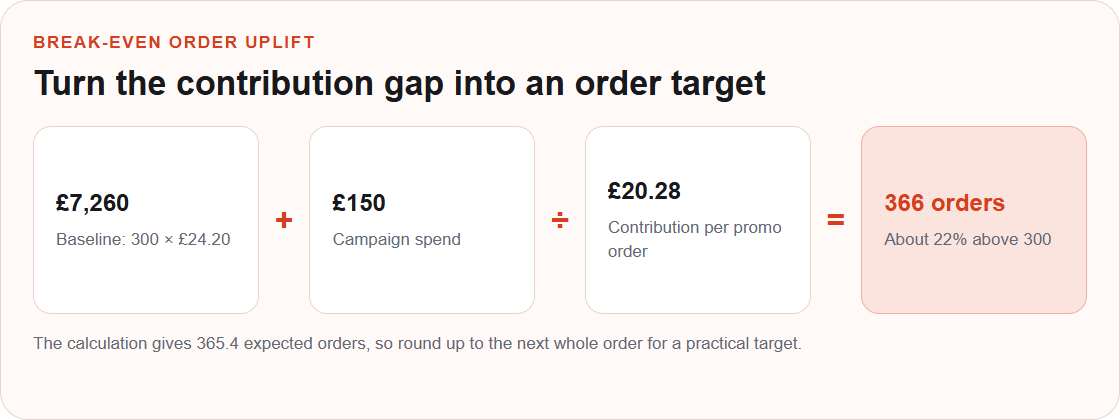
Add the £150 campaign spend to the £7,260 baseline contribution. The promotion therefore needs to produce £7,410 after the per-order costs, before campaign spend is subtracted. Divide £7,410 by £20.28 contribution per promoted order. The result is about 365.4 orders, or 21.8% above the 300-order baseline.
Orders are whole transactions, so use 366 as the practical minimum in this simple example. That represents a 22% increase over 300 orders. Rounding up matters: 365 orders would be just short of the modelled break-even point. Real reporting periods rarely match an exact calculation, so treat the decimal as a planning signal and compare it with observed results.
Change one assumption at a time and compare the contribution gap. The Promotion Lab keeps the calculation educational and makes the order-uplift threshold visible beside your scenario.
For a broader basket offer that is not primarily a discount, see how to test a basket offer without guessing. If you need to check the underlying price and costs first, read our practical UK guide to pricing an online product.
A mathematically clear model does not make unclear customer-facing terms acceptable. Explain which products or customers qualify, when the offer starts and ends, whether it can be combined with another offer, and any delivery or other unavoidable charges. The Competition and Markets Authority’s current price transparency guidance and its summary on clear and accurate prices explain that price information should be clear, complete and accurate, including mandatory charges up front.
If you advertise a saving against a previous or reference price, keep records that support the comparison and make sure the basis is clear. The Advertising Standards Authority’s advice on promotional savings claims explains that reference prices should represent a genuine established usual selling price and should not mislead. The CMA’s advice on urgency and price reduction claims online also warns businesses to avoid misleading scarcity and time pressure. Check the latest guidance for your offer and seek independent advice if you are unsure.
Calculate the baseline contribution and contribution per discounted order. Add campaign spend to the baseline contribution, divide by discounted contribution per order to find required orders, then compare required orders with baseline orders as a percentage.
Not necessarily. The uplift depends on your normal contribution, variable costs, fee structure, campaign spend and discounted contribution. In the example above, a 10% discount with £150 campaign spend requires about 22% more orders to match the baseline contribution.
If contribution per discounted order is zero or negative after the costs included, the model cannot calculate a finite break-even order volume. Review the cost and price assumptions before comparing an uplift.
This app compares contribution after the variable cost, fee rate and campaign spend you enter. It does not allocate fixed overheads. For a full business profit analysis, use complete accounts and consider all relevant costs with an accountant or other qualified adviser.
No. It is a threshold calculated from your inputs. It does not predict traffic, offer take-up or customer response. Use real campaign results to evaluate what happened.
A discount decision becomes more useful when the customer price, contribution, spend and measurement window are all visible. Calculate the threshold, state what you do not yet know, then compare the model with actual orders and costs. A result above break-even in one scenario is not a guarantee that the offer will work at scale.
Use the free Promotion Lab to compare a discount scenario, then check your wider store readiness and pricing before increasing spend.
Want to review your scenario with MLFG? Talk through your next test.
This article provides general educational information. It is not accounting, tax, legal or financial advice, and the worked example is not a forecast or a recommendation to discount. Verify your inputs and review current official guidance before relying on a promotion claim.
PREFERRED SOURCE
Like what you’re reading? Add Make Local for Global as a preferred source on Google to see more of our articles when you search.




















Build your online presence without having to figure out everything yourself.