

Learn how to compare ecommerce conversion by traffic source using a consistent session denominator, completed orders, and a weighted blended rate.


Two traffic sources can bring the same number of visits and produce very different numbers of orders. A third can look impressive because its rate is high, even though it reaches fewer people. To compare them fairly, use the same reporting period, the same session definition and the same completed-order event. Then calculate expected orders for each source and divide their combined orders by combined sessions.
This guide explains how to compare ecommerce conversion by traffic source, how to read a blended rate, and what to check before changing a campaign or store page. The free Conversion Lab can organise the arithmetic into a source breakdown and a clearly labelled what-if. It does not connect to analytics or predict future sales.
Enter sessions and completed-order rates for organic search, paid campaigns, and email or returning visitors. See expected orders, a blended rate, and illustrative gross sales in £.
A conversion rate is a chosen action divided by an eligible audience or visit count, expressed as a percentage. For the examples below, the action is a completed order and the denominator is sessions attributed to a traffic source:
Order conversion rate = completed orders ÷ sessions × 100. Keep the event and denominator consistent when comparing sources. A product view, add-to-basket event, checkout start and completed order are different actions, so they should not be mixed in one rate.
Analytics products can report users, sessions, events or transactions. Those measures answer different questions. A returning person may have several sessions, and a transaction can contain several items. Decide which measure answers your question before comparing channel results. For a store-level order rate, sessions and completed orders are a practical starting point, provided your analytics and order records are configured consistently.
The blended rate is not the simple average of the rates for each source. Each source contributes a different number of sessions, so calculate its expected orders first. Add those expected orders, then divide by all included sessions.
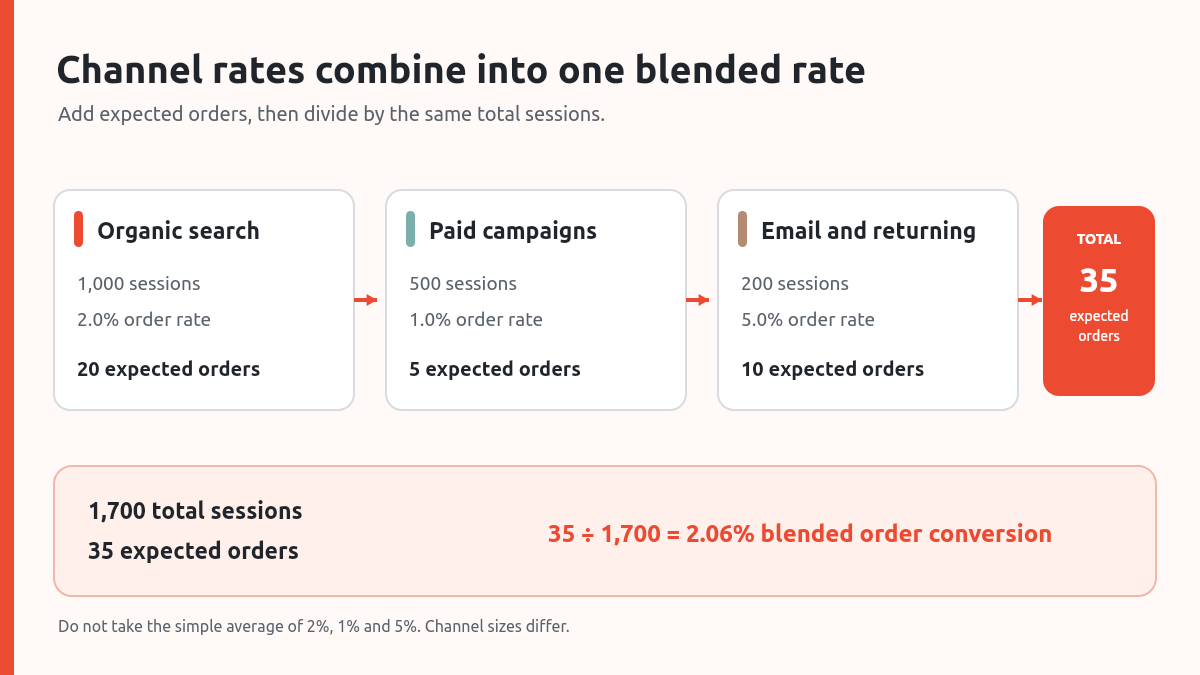
| Traffic source | Sessions | Completed-order rate | Expected orders | Illustrative gross sales at £35 AOV |
|---|---|---|---|---|
| Organic search | 1,000 | 2% | 20 | £700 |
| Paid campaigns | 500 | 1% | 5 | £175 |
| Email and returning | 200 | 5% | 10 | £350 |
| Blended total | 1,700 | 2.06% | 35 | £1,225 |
Here, organic search contributes 20 expected orders, paid contributes five, and email or returning visits contribute 10. Together that is 35 orders from 1,700 sessions, or about 2.06%. The simple average of 2%, 1% and 5% is 2.67%, which overstates the blended result because it treats the 200-session source as if it were as large as the 1,000-session source.
Expected orders can be fractional in other examples. For instance, 500 sessions at 1.5% gives 7.5 expected orders as an arithmetic average. It does not mean a store literally receives half an order. Actual orders are whole events and can vary from month to month.
Before drawing a conclusion, check that the figures describe comparable periods and definitions. A paid campaign that ran for only a week should not be compared casually with a full month of organic traffic. A promotion, out-of-stock product, broken tracking tag or different attribution rule can also change the numbers without the underlying customer journey changing in the same way.

Google Analytics 4 provides a useful example of why the event definition matters. Its ecommerce measurement guidance distinguishes events such as view_item, add_to_cart, begin_checkout and purchase. The GA4 Checkout journey report depends on configured ecommerce events, including begin_checkout, shipping and payment steps, and purchase. A custom funnel can help inspect sequential steps, but a funnel-stage rate is not interchangeable with a completed-order rate by traffic source.
For additional context, see Google’s ecommerce measurement guide, its documentation for the Checkout journey report, and Funnel exploration. These explain measurement setup and report behaviour; they do not establish a universal conversion benchmark for every shop.
A what-if is a way to make an assumption visible. Suppose a paid source has 500 sessions and a 1% completed-order rate. At an average order value of £35, that is five expected orders and £175 in illustrative gross sales before costs. If you model a 0.5 percentage-point increase, the assumed rate becomes 1.5%, or 7.5 expected orders. The arithmetic difference is 2.5 expected orders and £87.50 in gross sales.
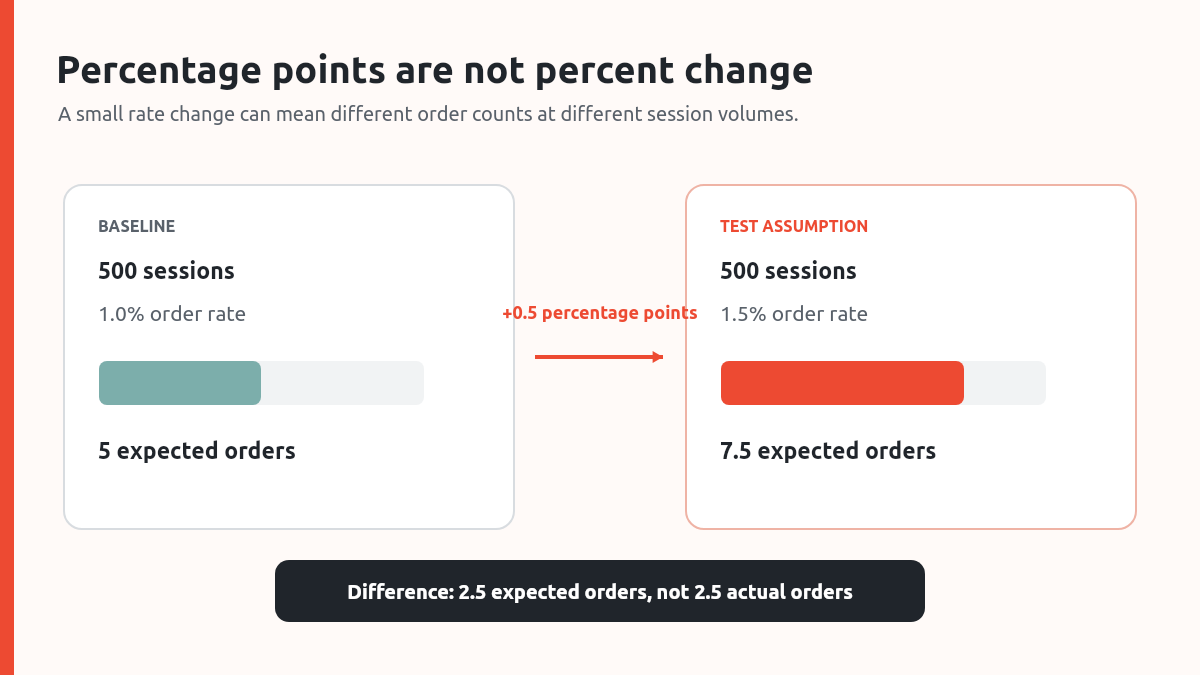
Notice the language: the result is an assumption to investigate, not a claim that a redesign or campaign will create those orders. A percentage-point change is the direct difference between two rates. In this example, moving from 1% to 1.5% is plus 0.5 percentage points and a 50% relative increase. They describe different comparisons. Use the unit that matches your evidence.
Use the lab to compare each source on the same basis, then choose one source and one change to investigate. The what-if keeps expected values separate from observed orders.
A high conversion rate is a useful clue, not a complete performance verdict. A smaller source may have a higher rate but provide few orders. A larger source may have a lower rate yet account for more orders. Gross sales also leave out advertising spend, product cost, fulfilment, payment fees, refunds, VAT treatment and staff time, so they are not profit or a return-on-ad-spend calculation.
Use three questions to move from comparison to action:
Change one meaningful factor where practical. If you change the advert, product page, price and delivery promise together, the next month may be different, but it will be hard to know why. Record the before-and-after period and any context that might affect the comparison. When traffic is limited, allow for natural variation and avoid treating a short run as conclusive evidence.
Use the measure that matches your question and keep it consistent. Sessions are useful when comparing visits attributed to sources. Users answer a person-level question and can have multiple sessions. If a dashboard reports a different denominator, do not compare its rate directly until you understand the definition.
Because sources have different session volumes. Multiply each source’s sessions by its rate to estimate orders, add those values, and divide by the total sessions. This weights each rate by its share of visits.
Yes. A smaller source can convert a larger share of its sessions and still contribute fewer total orders. Review both the rate and the expected or observed order count, along with cost and business context.
Not by itself. Conversion Lab estimates gross sales from expected orders and an average order value you enter. It does not deduct product, fulfilment, advertising, payment, tax or refund costs. Use separate cost data to evaluate contribution or profit.
It shows the arithmetic result if one source’s rate changed by the number of percentage points you enter and other inputs stayed fixed. For example, 1% to 1.5% is an increase of 0.5 percentage points. It is not proof that the change will happen.
Use Conversion Lab to set out the same-period source figures, record one what-if, and download a three-page review for your next planning session.
If you want a practical structure for acting on what you find, explore the Ecommerce Basics Mini Course and the guide to estimating ecommerce orders from website traffic. For help planning your store, you can also talk with MLFG.
PREFERRED SOURCE
Like what you’re reading? Add Make Local for Global as a preferred source on Google to see more of our articles when you search.

























Build your online presence without having to figure out everything yourself.