

A practical checklist for checking GA4 ecommerce events, product journeys, purchase values and reporting context in a small online store.

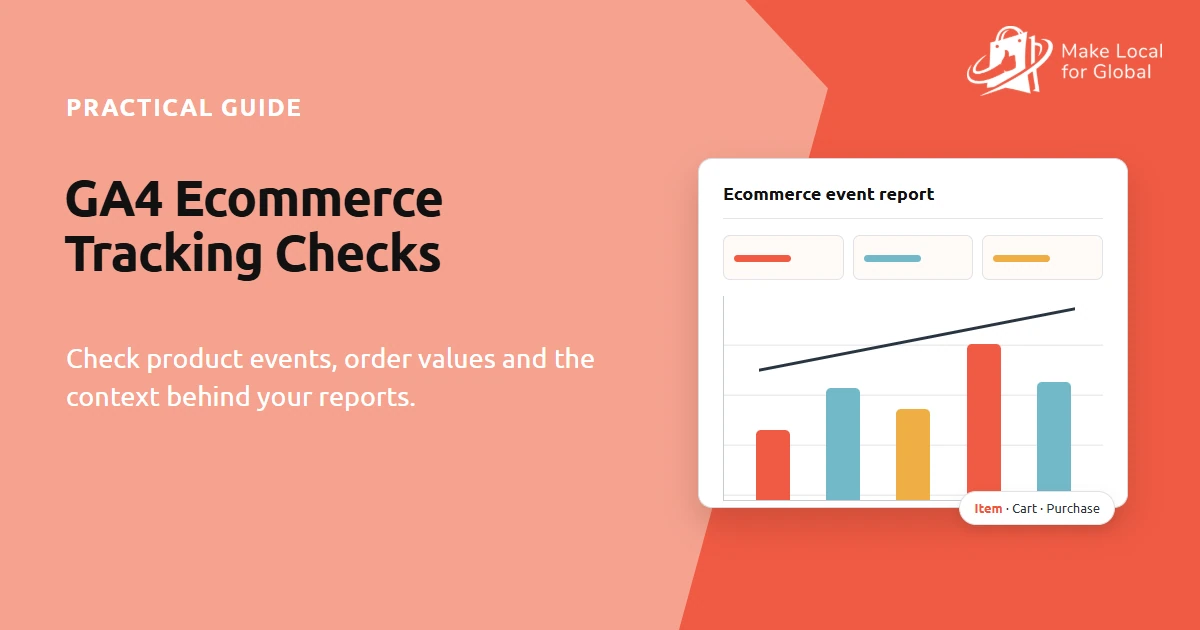
GA4 ecommerce tracking can show what people did on a store, but it cannot explain every reason behind their choices. Before you compare product views, basket additions or purchases, check that the events are implemented consistently, the reports cover the same period and the order values mean what you think they mean.
This guide gives small UK stores a practical way to review GA4 ecommerce events and store records together. It is not a setup manual for every platform. Event behaviour can vary by ecommerce integration, tag manager, consent settings and implementation, so use your own test environment and current provider documentation.
If your main question is how traffic may relate to order volume, see our separate guide to estimating ecommerce orders from website traffic. This article focuses instead on event collection, definitions and report checks.
Use the free Ecommerce Analytics Mini Course to check your tracking foundations, understand event definitions and create a short measurement plan.
It is easy to open a report, notice a number that moved and start looking for a reason. A more reliable routine begins with the decision. Are you checking whether a product page needs clearer information? Whether a campaign is bringing the right kind of visit? Whether order records match the purchase events? Each question needs a different measure and a different source of evidence.
Write the question in plain English before choosing the metric. For example: “During the last four complete weeks, how often did visitors to this product page add the item to their basket, and what should I inspect if the event is missing?” This defines a page, period, action and possible next step. It does not assume a benchmark or promise that changing the page will increase orders.

Google Analytics 4 has recommended ecommerce event names including view_item, add_to_cart, begin_checkout, purchase and refund. Their meaning depends on the implementation: a product-view event should happen when the relevant product is viewed, while a purchase event should correspond to a completed transaction in your store journey. The event names alone do not prove that the information is accurate.
Check the platform connection or tag setup, the event trigger and the parameters attached to each event. For a product journey, item identifiers should stay consistent between product view, basket and checkout events. A purchase should carry a transaction identifier that helps distinguish one order from another. Use GA4 DebugView or the platform’s own test tools to inspect events in a safe test session. Google notes that debug events require debug mode and that client-side privacy controls or consent settings can affect what appears there.
Do not create test transactions in a live store unless your platform provides a safe test mode. A test event can contaminate reports, and a real payment or customer order should never be used just to see whether a tag fires. Keep development and test traffic separate or filtered according to your analytics setup.

Purchase reporting can disagree with the order platform even when both are working as designed. One report may include delivery in a displayed total while another separates it. Refunds, tax, discounts, currency conversion, duplicate events and delayed updates can also change the figures or the period in which they appear.
For GA4 ecommerce events, Google’s guidance says that if you send a value parameter, you should also send a three-letter ISO currency code. For purchase values, its recommended calculation is the sum of item price multiplied by quantity, excluding shipping and tax from that value. Shipping and tax can be sent as separate parameters. Check current implementation guidance before changing your setup because a platform integration may already handle these fields.
| Check | What to compare | Why it matters |
|---|---|---|
| Transaction ID | Analytics event and store order reference | Helps identify missing or duplicated purchase events. |
| Currency | Event currency and store currency | Values are difficult to compare if currency is absent or inconsistent. |
| Order value | Item price multiplied by quantity, plus separately recorded charges | Reports may include or exclude shipping, tax, discounts or refunds differently. |
| Date and status | Event date, order date, cancellation and refund status | Events and operational records may update at different times. |
Analytics is not a substitute for accounting records. Use the records and advice appropriate to your financial and tax obligations. The purpose of this check is to understand how a report was constructed, not to decide which system is legally authoritative for every business.
A funnel can help you inspect how recorded events change across steps. You might compare item views with basket additions, checkout starts and purchases for one product. Before reading a percentage as a conversion rate, check that the report uses a consistent date range, item scope, metric definition and event implementation.
Event totals are not necessarily a count of unique people moving once through a fixed path. Someone may return later, change device, browse several items, leave and come back, or have activity that is not recorded because of privacy controls, browser settings or an implementation gap. A sharp difference between steps is a reason to investigate the event and user journey, not proof that one page caused abandonment.
Work through the free lessons to record the events you use, the definitions you still need to verify and one careful next check.
Traffic-source reports help describe where recorded activity was attributed. They do not provide a complete record of every influence on a purchase. Links without consistent campaign tags, cross-device journeys, consent choices, direct visits and the attribution model can all affect the source shown in a report.
Google Analytics offers multiple attribution models and settings. Attribution is a method for assigning credit across recorded touchpoints, not a causal experiment. When reviewing a channel, note which report and attribution model you used. Compare a similar period and consider whether the campaign, offer, stock level, pricing or site experience changed at the same time.
Use campaign tags consistently on links you control and avoid adding personal information to URLs. For privacy and compliance decisions, read current guidance from the ICO and check the behaviour of your consent platform and analytics configuration. Requirements can depend on the technology and processing involved, so this article is not legal advice.
A weekly or monthly review does not need to start with a large dashboard. Choose one outcome measure and one or two diagnostic measures tied to a current question. Record the source report, filter, period, metric definition and any known tracking limitation. Add operating context such as a product being out of stock, a price change, a promotion, a site release or a fulfilment issue.
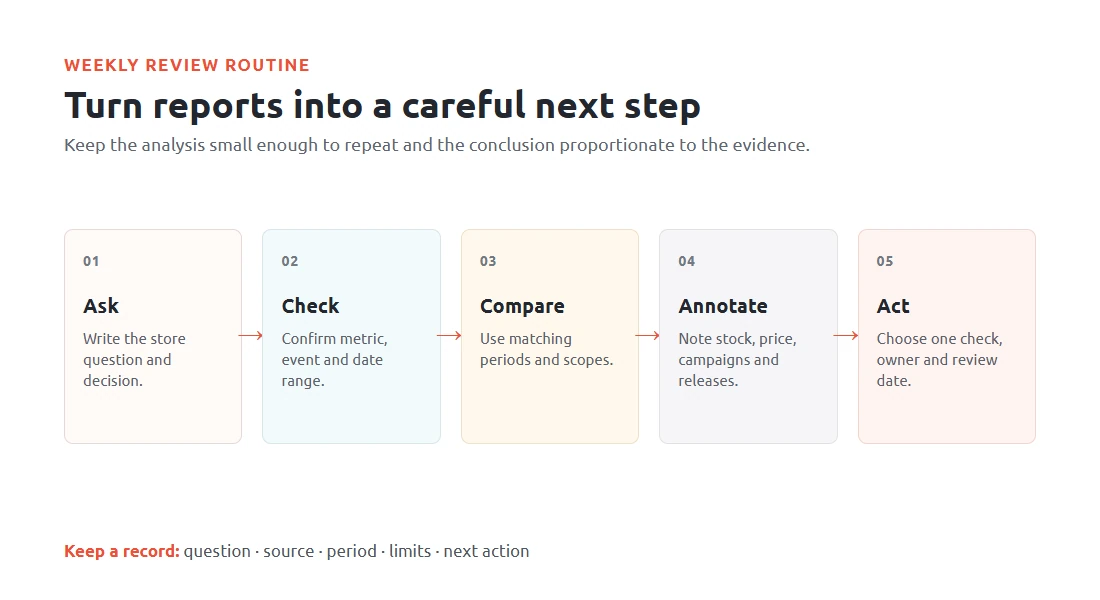
Write down what you observed separately from what you think it means. “Purchase events decreased in this report” is an observation. “The new product page caused the decrease” is a causal explanation that needs more evidence. If the result matters, inspect the implementation, compare operational records and design a suitable test before making a larger change.
Start with the events that answer your current question. For a product journey, that may include view_item, add_to_cart, begin_checkout and purchase. Check the implementation and parameters in current documentation rather than assuming a standard name guarantees correct tracking.
Check transaction IDs, event timing, currency, value rules, shipping, tax, discounts, cancellations and refunds. The two systems may define totals differently or update on different schedules. Reconcile a sample and document what each figure includes.
Attribution assigns credit using a model and the touchpoints that were recorded. It can help compare reporting views, but it does not prove that a campaign caused an order. Use a suitable experiment and operational evidence when you need a causal answer.
For a hands-on next step, complete the Ecommerce Analytics Mini Course and save your own measurement plan. The tool organises your answers; it does not verify your live analytics property or guarantee that a change will improve results.
Use the course to organise your metrics and event checks. If you are ready to set up your store, compare the current £99/year plan or talk through your requirements.
Sources: Google Analytics ecommerce measurement guide, GA4 recommended event reference, Google Analytics DebugView guide, Google Analytics attribution guide and the ICO guide to cookies and similar technologies.
PREFERRED SOURCE
Like what you’re reading? Add Make Local for Global as a preferred source on Google to see more of our articles when you search.
























Build your online presence without having to figure out everything yourself.