

Plan your first 100 ecommerce orders by working backwards from traffic, conversion, order value and fulfilment capacity, then track five practical milestones.

Your first 100 ecommerce orders are easier to plan when you stop treating 100 as one distant number. A useful plan works backwards from the target: how many orders are needed each week, how many relevant visitors may be required, whether the store can fulfil that demand well and which marketing route deserves the most attention.
This guide shows you how to create that plan without pretending the result is a forecast. You can also use the free First 100 Orders Planner to calculate your weekly pace and download a three-page roadmap.
Choose your target period, order value, conversion assumption, traffic capacity, fulfilment capacity and main acquisition route. The app will organise them into a practical roadmap.
A good plan connects demand, conversion and operations. It does not simply list marketing ideas. At minimum, it should answer five questions:
The word assumption matters. A new shop does not yet have enough data to know its normal conversion rate, average order value or repeat purchase behaviour. Start with explicit planning numbers, then replace them with actual data as orders arrive.
One hundred orders in 30 days requires a very different operation from 100 orders in 180 days. The shorter target needs more weekly traffic, faster customer support and greater fulfilment capacity. It may also require a larger marketing budget or an existing audience.
Work out the weekly pace by dividing 100 by the number of weeks in your target period. A 90-day target is about 12.9 weeks, so the plan needs roughly 7.8 orders per week. Keep the decimal in the calculation because it shows the real pace, then translate it into a practical weekly range.
| Target period | Approximate weeks | Orders needed per week |
|---|---|---|
| 30 days | 4.3 | 23.3 |
| 60 days | 8.6 | 11.7 |
| 90 days | 12.9 | 7.8 |
| 180 days | 25.7 | 3.9 |
Choose the period by looking at your time, stock, production speed, audience and budget. A slower plan that you can sustain is more useful than an exciting target that depends on daily activity you cannot maintain.
For this planner, conversion rate means the percentage of relevant website visits that become orders. If 100 people visit and two place an order, the simple visit-to-order conversion rate is 2%.
To estimate the traffic needed for 100 orders, divide 100 by the conversion rate written as a decimal. At 2%, the equation is 100 ÷ 0.02, which produces 5,000 relevant visits. At 1%, the same order target needs 10,000 visits. The arithmetic is exact, but the chosen rate is still an assumption.
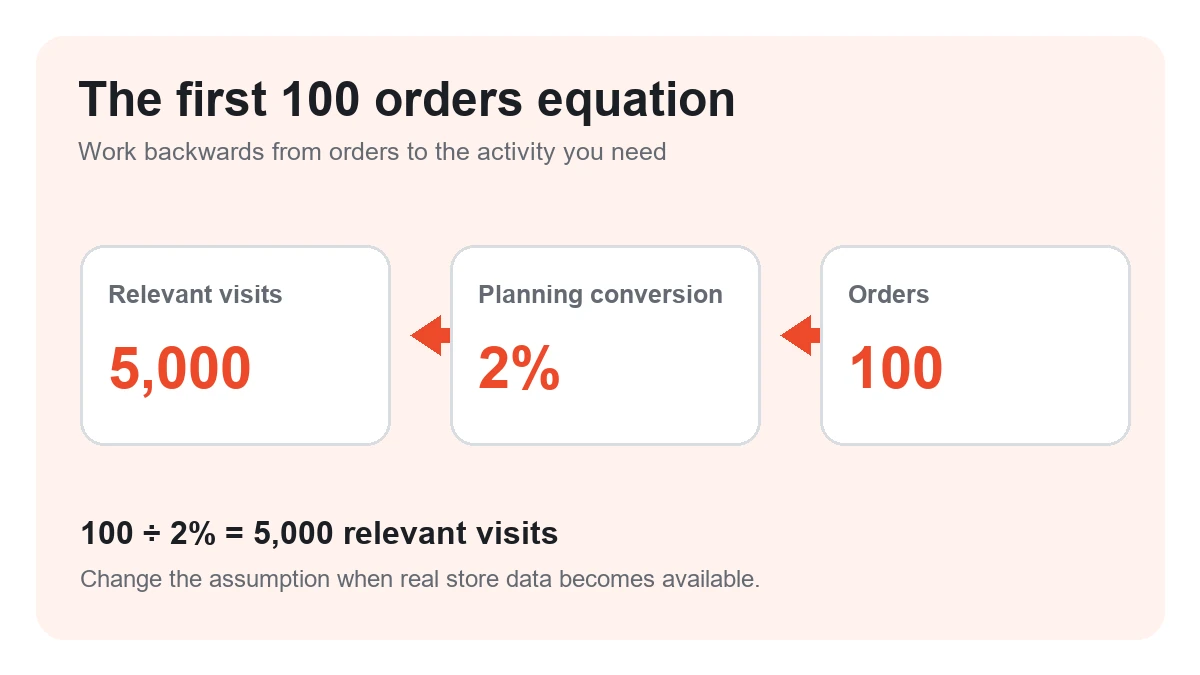
Do not borrow an attractive industry benchmark and treat it as a promise. Conversion changes with traffic quality, product price, brand trust, device, delivery offer, season and the buying decision. Use a cautious number, record the source of the assumption and update it every week.
A large audience is not automatically useful. Ten thousand views from people who do not need the product may produce fewer orders than 300 visits from a specific community with a strong reason to buy.
Relevant traffic comes from people whose situation, interest and location match the offer. Before choosing a channel, be able to describe the customer in plain language. Our guide to choosing an ecommerce business can help if the model and audience are still unclear.
Shopify’s current marketing guidance groups customer acquisition activity around routes such as search, content, email, social media, promotions, creators and paid campaigns. It also recommends measuring marketing performance after campaigns begin. The useful lesson is not to use every route at once. Pick one primary route that fits the audience and the work you can sustain, then use supporting channels deliberately.
Your first 100 orders may come from several sources, but your weekly plan needs a centre. Choose the route where the product, audience and your own strengths meet.
Turn the chosen route into repeated actions. “Use Instagram” is not a plan. “Publish three useful demonstrations each week, answer one buying objection and link to the most relevant product page” is measurable and reviewable.
The planner compares the traffic and fulfilment capacity you enter with the pace needed for your target. Use the result to decide what needs attention first.
Marketing can create a problem if the shop cannot fulfil the resulting orders safely. Capacity includes more than packing. It may include making or sourcing the product, checking quality, printing labels, answering questions, processing returns and handing parcels to the carrier.
Estimate the number of orders you can fulfil per week without damaging product quality or customer communication. Compare that with the weekly order target. If the plan needs 12 orders per week but you can fulfil only six, the immediate task is not to double traffic. It is to simplify the offer, increase capacity, extend the target period or create a controlled release schedule.
This is particularly important for handmade, personalised, perishable and made-to-order products. A clear delivery promise and honest stock position are part of the customer experience, not small operational details.
Milestones give you a reason to stop and learn before the final total. Each point should have a question attached to it.

The order count is a learning structure. It is not proof that the business is profitable. A shop can reach 100 orders while losing money or creating an unsustainable workload. Review unit economics and customer experience alongside volume.
Early reporting should be simple enough to maintain. Record relevant visits, completed orders, conversion rate, average order value, refunds and weekly fulfilment capacity. Add marketing cost when you use paid campaigns.

Use one definition consistently. Decide whether “visitors” means users or sessions in your analytics platform and keep the same measure when comparing weeks. Confirm that completed orders, test orders, cancellations and refunds are handled consistently. Small data sets will move sharply, so look for patterns across several weeks rather than reacting to every daily change.
At the start of the week, confirm the target number of relevant visits and orders. Schedule the acquisition actions you control. Check stock and fulfilment capacity. At the end of the week, record the six dashboard numbers, read customer questions and choose one improvement for the next cycle.
If traffic is below plan, improve the consistency and relevance of the primary channel. If traffic is present but orders are weak, review offer clarity, product information, delivery, trust and checkout. If orders exceed capacity, slow promotion and fix operations before adding demand.
The most valuable result of the first 100 orders is not the number itself. It is the evidence you collect about customers, channels, products, pricing and operations. Use that evidence to create the next target with better assumptions.
The free planner gives you a starting model and a PDF you can revisit. It will not predict sales, but it will make the relationship between traffic, conversion, order value, time and capacity easier to see.
Use the free planner to organise your roadmap. When you are ready for the ecommerce setup, MLFG can provide your store, hosting, domain, business email, AI tools and training in one £99/year plan.
There is no reliable universal timeline. It depends on the offer, audience, traffic, conversion, price, trust, season, budget and fulfilment capacity. Choose a period you can support, calculate the weekly pace and revise it using actual data.
Divide 100 by your visit-to-order conversion rate written as a decimal. At 2%, the planning calculation is 5,000 visits. At 1%, it is 10,000. These are mathematical outputs from assumptions, not sales guarantees.
The best route is the one that reaches the right customer and matches the product, budget and work you can sustain. Organic social, email, search content, partnerships and paid advertising can all be useful in the right situation.
No. Order volume and revenue do not show profit on their own. Review product cost, packaging, delivery, payment fees, platform costs, refunds, discounts, tax, marketing and your time.
Review which customers, products and channels produced healthy orders, which operational problems repeated and whether buyers returned or referred others. Use that evidence to set the next target and remove the main constraint.
PREFERRED SOURCE
Like what you’re reading? Add Make Local for Global as a preferred source on Google to see more of our articles when you search.























Build your online presence without having to figure out everything yourself.